
BP - Health & Safety Data homepage
DAFWCF (Group)
DAFWC (Group)
RIF (Group)
RI (Group)
Fatality rate (Group)
Fatalities (Group)
Cumulative change (All rates)
Business segment comparisons (RI)
Business segment comparisons (DAFWC)
|
|
|
BP - Health & Safety Data
|
|
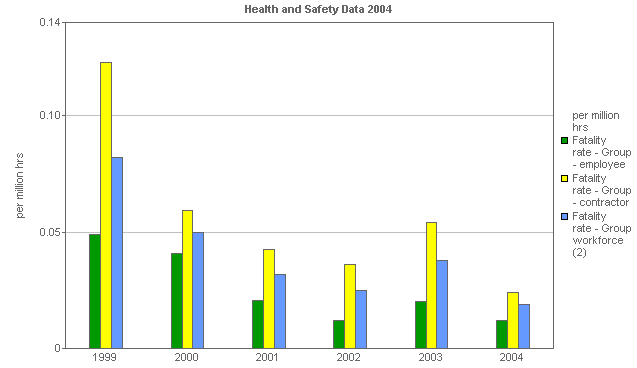
Fatality rate (Group)
The fatality rate is measured by the number of fatalities per million hours worked. This bar chart shows the fatality rate analyzed by employees, contractors and the overall workforce.
|
|
 |
|
| | Units |
1999 |
2000 |
2001 |
2002 |
2003 |
2004 |
|---|
| Fatality rate - Group workforce (2) | per million hrs | 0.082 | 0.050 | 0.032 | 0.025 | 0.038 | 0.019 |
|---|
| Fatality rate - Group - employee | per million hrs | 0.049 | 0.041 | 0.021 | 0.012 | 0.020 | 0.012 |
|---|
| Fatality rate - Group - contractor | per million hrs | 0.123 | 0.059 | 0.042 | 0.036 | 0.054 | 0.024 |
|---|
(2) Fatality rate - The number of fatalities per million hours worked.
|
|
