Operating & Financial Review
Balance sheet management – Investment management
Our approach to investment management is intended to optimise returns from available asset classes for a given level of modelled investment risk. We separate the investment funds into two parts, for London and Bermuda, because of the different levels of risk that we are willing to accept for each part. Distinction is made between capital assets, which support the underwriting business, and policyholders’ funds, which are the premiums received and held to meet future insurance claims.
Our risk appetite for policyholders’ funds is relatively low. We aim to match currency and duration of assets with our liabilities to minimise the risk of mismatched future cash flows to meet claims. This, and regulatory constraints, leads us to invest largely in highly liquid, high quality short term bonds and cash.
The average duration of the bond portfolios is shown below.
Some additional value can be added by the Chief Investment Officer taking tactical decisions to move a limited amount away from core benchmarks, by for example holding cash when bond valuations are considered to be particularly high. In addition the investment managers can invest away from the core government bond benchmark into securities such as corporate debt and asset/mortgaged backed securities or overseas bonds.
During 2006 a small element of the bond assets were invested in a fund which has some scope to invest in high yield and emerging market debt as well as to take short positions. By giving the manager a wider opportunity set, the reward/ risk profile of these investments is improved.
The Group has a longer investment horizon for its capital and allows investment in more volatile assets such as equities. In 2006 a small allocation was also made to property because of the long-term diversification benefits that this asset class provides.
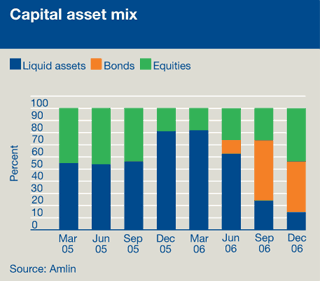
The strategic benchmarks for capital are set using a combination of efficient frontier(1) and value at risk(2) models. During 2006 the risk appetite remained low due to the firm underwriting market. At the start of the year all Bermuda’s capital was invested in cash, which diluted the Group’s equity exposure. Advantage was taken of the equity markets’ correction in the spring to start to build up exposure to this asset class. In August Bermuda’s asset mix started to be moved in to bonds and equities. The progression of the Group’s asset mix is shown in the table below.
Currency management
 Foreign exchange risk is currently managed at entity level depending on the local functional currency. The Group reports in sterling but manages a sterling business in the UK and a US dollar business in Bermuda. For the UK operations we sell trading currency profits into sterling to mitigate the impact of fluctuating exchange rates.
Amlin Bermuda manages its US dollar trading position and holds its balance sheet in US dollars reflecting its global underwriting profile.
At Group level we have currently chosen not to hedge the net dollar asset exposure of Bermuda. Our balance sheet is spread between sterling and US dollars – a natural hedge for our two main markets. During 2006 this lead to £77.3 million of exchange translation losses, which are recognised through reserves. However over time we would expect a more balanced position to emerge.
Estimation of outstanding claims reserves
The estimation of the Group’s outstanding claims reserves is a key component of effective management of the balance sheet. It effects the annual financial result but it also effects investment management, as different approaches are taken for capital and policyholders’ funds.
Our reserve estimation is completed on a regular quarterly basis at individual class level. This allows the differing risk profiles of each class and patterns of claims development to be considered. Reserving is highly subjective and at any time there are a range of different possible outcomes at which the claims reserves could ultimately settle. As time passes the uncertainty surrounding likely claims settlement reduces and the level of caution is reduced.
In the face of this uncertainty we reserve prudently. However to ensure that the reserving levels are consistent, we compare the accounted reserves with actuarial estimates that are set at a “best estimate” level.
(1) An Efficient Frontier is related to the Markowitz Model of constructing a diversified portfolio. In a graph showing expected return and risk of different portfolios, the Efficient Frontier is the line along which the optimal portfolios lie. That is those showing the best return for a given level of risk.
(2) Value at risk (VaR) is a technique which uses the statistical analysis of market returns, correlations and volatilities to estimate the likelihood that a given portfolio’s losses will exceed a certain amount under usual circumstances. The Amlin model uses market data from Watson Wyatt Investment Consulting. The model calculates the VaR over a 12 month period at different confidence levels. The confidence level is the degree of assurance that a specific loss is not exceeded. A 99% confidence level (VaR99) is used to set the strategic benchmarks, which means that the loss should only be exceeded once in a hundred years, in normal market conditions.
