3i at a glance


3i's Smaller Minority Investments ("SMI") initiative, established in 2001, generates returns from some of our older and lower-growth investments. It is our objective to realise the SMI portfolio over the medium term. SMI comprises 807 investments valued at £762 million, representing 18% by value and 54% by number of 3i's total portfolio.
Our purpose:
to provide quoted access to private equity returns
Our vision:
- - to be the private equity firm of choice;
- - operating on a world-wide scale;
- - producing consistent market-beating returns;
- - acknowledged for our partnership style; and
- - winning through our unparalleled resources.
What we do
3i is a world leader in private equity and venture capital, investing in Buyouts, Growth Capital and Venture Capital.We use our international network to source and assess a wide range of investment opportunities, selecting only those which meet our return and quality criteria. Then, having made an investment, we work in active partnership with the boards of our portfolio companies to create value all the way through to the ultimate realisation of our investment.
Where we operate
3i operates through a network of teams located in 13 countries in Europe, Asia and the US.We continue to build and refine our network and are in the process of opening an office in Shanghai and recruiting a team to develop a business in India.
What differentiates 3i
3i's network, resources, scale and approach are our key differentiators. All of these deliver market access, insight for investment decision making and the ability to add significant value to the companies in which we invest.The strength of 3i's balance sheet also enables us to take a more flexible and longer-term approach to the financial structuring of individual investments.
Our business lines
Buyouts
3i's mid-market Buyout business operates primarily on a pan-European basis, investing in businesses with a transaction value of up to €1 billion.
- Case studies
- Keolis
- Travelex
- Westminster Healthcare
- Yellow Brick Road
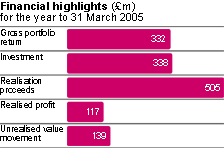
Gross portfolio return

22%
Portfolio value
£1,570m

Growth Capital
3i's Growth Capital business makes minority investments in established and profitable businesses across Europe and Asia, typically investing between €10 million to €100 million per transaction. This business line also manages 3i's minority equity investments in smaller buyouts.
- Case studies
- Focus Media
- Pearl
- Pets at Home
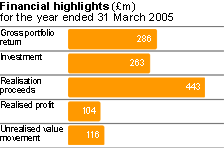
Gross portfolio return

24%
Portfolio value
£1,226m

Venture Capital
3i's Venture Capital business operates on an international basis, with a focus on the software, communications, healthcare and electronics sectors, typically investing between €2 million and €10 million per transaction.
- Case studies
- Babelstore
- Vette Corp
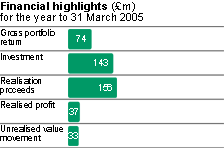
Gross portfolio return

11%
Portfolio value
£743m

