Operating and financial review
This review includes a description of 3i’s business and
strategy and comments on 3i’s performance during the year in the
context of the economic and market environment and other
influences. The review also discusses 3i’s financial position,
including changes to its capital structure, and comments on the
main risks inherent in 3i’s business and the framework used to
manage them.
3i’s business and strategy
3i’s business
3i’s business focus continues to be to invest in buy-outs, growth
capital and venture capital. Geographically, most of our investment
is in businesses based in western Europe, although 3i does have
growing investment operations in the US and in the Asia Pacific
region. In the US, 3i currently invests in businesses engaged in
technology sectors; while elsewhere 3i invests across a broader
range of industry sectors and in each of the investment activities
identified above.
Buy-outs
3i invests in European mid-market buy-out transactions with a value
between €25 million and €800 million. The vendors of the businesses
being sold are typically large corporates disposing of non-core
activities or private groups with succession issues.
3i targets the mid-market because that is where we believe we
can create the most value. There is less competition for
transactions in this market than for larger deals and price is less
likely to be the sole or key criterion in “winning the deal” – we
believe that, in the mid-market, the relationships we build through
our local presence are just as important. Additionally, the nature
and size of businesses in this market are such that we are more
able to add value through strategic, operational and management
input; and, in this market, the underlying businesses will
generally have greater growth potential than larger ones and be of
such a size as to make them more attractive acquisition targets for
a greater number of strategic purchasers.
3i is also active in the smaller buy-out market (below €25
million), both in western Europe and in the Asia Pacific region.
This is a more fragmented segment of the market and one in which
3i’s local network provides good access to the private vendors,
management teams and local advisers involved.
Growth capital
3i makes growth capital investments of between £5 million and £50
million, across a broad range of sectors, business sizes and
funding needs. These investments typically involve 3i acquiring
minority stakes in established businesses. We therefore seek to
ensure a high level of influence and an attractive yield in these
situations. 3i’s growth capital business is primarily focused on
3i’s European and Asia Pacific markets and has historically had a
less competitive environment than buy-outs.
Success in this market is determined by the ability to build
long-term relationships with local businesses and local
intermediaries, as well as demonstrating the capability of helping
these businesses to grow. This fits well with 3i’s strategy of
local presence, sector specialisation, sharing knowledge and
offering local businesses access to 3i’s international network of
relationships.
Venture capital
3i’s venture capital business is targeted at four key sub-sectors –
healthcare, communications, software and electronics,
semiconductors and advanced technologies (“ESAT”). The main
geographic focus is western Europe and the US, though 3i does also
invest in the Asia Pacific region.
Investment in venture capital takes the form of participation in
a series of “funding rounds” and we therefore separate out “first
investments” (those in businesses where 3i is not already invested)
and “further investments”. 3i aims to invest between £1 million and
£10 million in each new opportunity and, depending on circumstances
and market conditions, we would generally expect 3i’s venture
capital investment to be split broadly 50:50 between first
investments and further investments in any year.
3i’s strategy
The key elements of 3i’s strategy are as follows:
- to develop the business internationally;
- to build a balanced investment business;
- to use the network as our key competitive advantage; and
- to invest in companies where there is potential to grow profits
significantly.
Globally, private equity and venture capital investment is
concentrated in the US and Europe, with the Asia Pacific region
showing strong growth. We currently have a strong European presence
and aim to grow our activities in the US and Asia. 3i targets
investment across a broad range of industrial sectors and also
invests at all stages of the corporate lifecycle, from start-ups to
buy-outs. We continue to target businesses where we believe we can
help to grow profits significantly.
Integral to our strategy is the ability to use 3i’s network to
generate returns that are greater than those of our competitors. As
business becomes increasingly international and complex, we believe
that the network provides 3i with real competitive advantage
through each phase of the investment lifecycle – origination of the
investment opportunity, developing and validating the business
case, structuring and making the investment, implementing the
operational plan for the business, and exit.
The main elements of what we refer to as “our network” are as
follows:
- local presence – this enables 3i to build strong relationships
with entrepreneurs, corporates, universities, research
organisations and intermediaries, and is particularly important in
the deal origination phase of the investment lifecycle;
- sector specialisation – underpinning 3i’s ability to build
meaningful business relationships, sector specialisation is
critical in the phases of developing and validating the investment
case and subsequently implementing the growth strategy. Our sector
teams are drawn from 3i’s Industry Group, which comprises around 20
experienced senior industry specialists, and 3i’s investment and
portfolio management executives;
- “product” specialisation – each of buy-outs, growth capital and
venture capital has teams of specialist investment executives
skilled in project management and financial structuring specific to
the product. 3i’s scale and structure also allow us to utilise
specialist skills in a number of other areas, including portfolio
management, restructuring and turnarounds, and exits and IPOs of
companies from 3i’s portfolio;
- sharing knowledge and contacts – the importance of knowledge
and strong relationships in each phase of the investment lifecycle
is difficult to overstate in the private equity and venture capital
investment business and, for 3i, the benefits of sharing these
across the organisation represent a substantial source of
competitive advantage. We believe we have in place the systems,
processes and structures and, as importantly, the corporate culture
to help 3i maximise the potential benefits;
- relationships with corporates – another benefit of 3i’s scale
and organisation is that we have meaningful relationships with a
large number of corporates in each of the geographies in which we
operate. These relationships are particularly useful at the
origination, investigation and exit phases of an investment.
Furthermore, 3i’s ability to make effective business introductions
across a range of geographies is increasingly a critical factor in
our ability to “win deals” and provides 3i with a distinctive
source of value creation; and
- strengthening boards and management teams – the “People
Programmes” 3i runs for chairmen, chief executives, chief financial
officers and independent directors provide an excellent resource
for building and strengthening boards and operational management;
and are also a strong source of both investment opportunities and
due diligence capability.
Organisation and office network
There have been no changes since March 2003 in the leadership of
our three investment businesses. Jonathan Russell continues to lead
the pan European mid-market buy-out business; Chris Rowlands leads
the growth capital and smaller buy-out business; and Rod Perry
leads the venture capital business.
Within each of these activities, a panel of our most experienced
investors ensures rigorous application of our investment processes
and provides guidance to help ensure we maximise value across each
phase of the investment lifecycle. These panels also seek to
ensure, on a case-by-case basis, that we assemble “the best team
for the job” from the regional, sector and product specialists.
The investment and divestment approval functions for larger
transactions are carried out by two Investment Committees,
addressing technology and non-technology investments respectively.
The membership of these Investment Committees is drawn from 3i’s
Executive Committee.
3i’s Smi (small and medium-sized investments) initiative, which
was established in 2001 and which reports to Chris Rowlands,
continues to be successful in generating returns from some of the
older and lower-growth investments and, importantly, in enabling
non-Smi investment professionals to focus on identifying investment
opportunities and managing larger investments. At 31 March 2004,
£698 million of value (16% of 3i’s total portfolio) and 849
investments (45% by number of 3i’s total portfolio) were managed by
the Smi team.
There were no changes to the office network during the year,
though we have just announced that 3i’s offices in Padua and Nantes
will close in the summer of 2004. 3i will then have a total of 29
offices (25 across Europe and two each in the US and the Asia
Pacific region). We continue to recognise the need to deploy
resources through critical mass teams based in locations of
greatest opportunity. To this end, 3i’s Glasgow, Bristol and Leeds
offices were, in February, directed to focus on portfolio
management, with the executives responsible for new investment in
these offices being redeployed. We do not anticipate any
substantial changes to the current network of offices.
During the year, headcount was reduced from 858 to 750,
reflecting a continued application of the cost reduction measures
and changes in investment processes and resource alignment
initiated over recent years.
Operating review
Macroeconomic and market conditions
The macroeconomic environment in the regions where 3i has
operations improved substantially during the financial year under
review. Looking at the period as a whole, perhaps the key defining
features of the economic environment were as follows: gradually
improving consumer and business confidence from the lows
experienced during the extended build-up to hostilities in Iraq,
though ongoing geo-political uncertainty appears to be a fact of
life; the significant strengthening during the period of sterling
and the euro compared with the US dollar and a number of Asian
currencies, which has impacted the competitive position of a number
of our portfolio businesses; improving economic growth outlook for
the US and, to a lesser degree, for Europe, though across most of
Europe levels of government spending remain high; and the strength
of the Chinese economy and the implications of this for western
economies and businesses.
Stock market conditions and mergers and acquisitions (“M&A”)
activity levels also showed improvement through the financial year.
Most stock market indices rose substantially, reflecting improving
confidence in underlying economic growth and the prospects for
corporate earnings. The increased business confidence, improving
stock market conditions and continuing low interest rates are all
enabling and encouraging businesses to recommence their disposal
and acquisition strategies, though the number of completed M&A
transactions remains subdued, both in Europe and globally.
The private equity and venture capital markets are also showing
increased activity after a slow first half of 2003. Market
statistics for 2003 show that total private equity and venture
capital investment in Europe fell by 16.5% compared with 2002, with
“high technology” investment down 25%, “growth” investment down by
29.4% and buy-out investment down by 9.5%. The second quarter
experienced the lowest levels of investment (as expected, given the
prevailing uncertainty and consequent deferment of business
decisions), with strong increases in the third and fourth
quarters.
Elsewhere, the “high technology” segment of the market in North
America showed a 5% increase in total investment over 2002; and
investment levels in Asia Pacific rose very substantially in 2003
to a new “all-time high”.
Conditions for realisations were difficult for most of 2003,
with relatively few active trade buyers and continuing low levels
of IPOs by historical standards. Market statistics for Europe show
a 25% fall in the number of divestments in 2003 compared with 2002.
However, we are seeing encouraging levels of renewed interest by
trade buyers for strategic assets and the IPO markets are showing
signs of re-opening, at least for strongly performing and
profitable businesses.
There were also a number of features specific to the markets of
each of our three investment businesses. Activity in the pan
European mid-market for buy-outs was driven largely by strategic
reorganisation and restructuring initiatives within conglomerates
under continuing pressure to sell off non-core assets and manage
their balance sheets. In addition, secondary buy-outs (where a
private equity investor buys a business from another private equity
investor) were a significant feature during the period, accounting
for 31.3% of investment (by transaction value) in 2003. This is a
reflection of the amount of buy-out funds raised and seeking
investment opportunities and also, on the sell side, of the
pressure on some funds to sell investments and return cash to
investors.
Within the European growth capital market, investment in 2003
was down sharply on 2002, largely as a result of growth and
acquisition plans being deferred in an environment of business
uncertainty during the first half of the year. Since then, these
strategies have increasingly been recommenced and we believe that
the use of private equity to facilitate cross-border expansion
within the European market is a key driver of investment
opportunity.
The venture capital markets are seeing increased levels of IT
spending by businesses as well as improved conditions for
realisations as the appetite of corporates for buying
venture-backed businesses improves and stock markets re-open to
some extent to technology companies. Reduced levels of competition
following the fallout from the “technology bubble” are also a
feature of the marketplace in Europe, though competition for
particularly good opportunities is still significant.
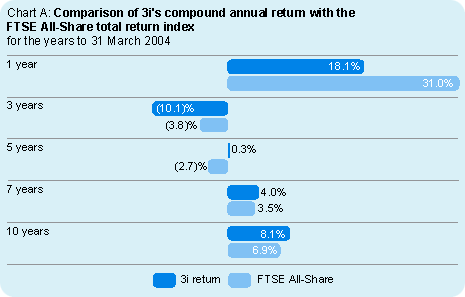
Total return
3i achieved a total return of £531 million for the financial year,
which equates to 18.1% on opening shareholders’ funds. While this
compares with returns on the FTSE 100 and FTSE All-Share total
return indices of 25.7% and 31.0% respectively, it is normal that
3i’s returns lag an upturn in quoted markets. This is because our
valuations of unquoted investments are generally based on
historical earnings and our venture capital investments are not
marked up in line with a rise in quoted markets.
The components of the total return are shown in table 1; and
table 2 contains an analysis of total return by business and
geography.
 |
 |
 |
| |
| Table 1: Total return |
|
|
| |
2004 |
2003 |
| |
£m |
£m |
| Total operating income before interest payable |
267 |
308 |
| Interest payable |
(93) |
(110) |
| Management expenses |
(163) |
(163) |
| Realised profits on disposal of investments |
228 |
190 |
| Unrealised profits/(losses) on revaluation of investments |
336 |
(1,159) |
| Carried interest and investment performance plans |
(40) |
(12) |
| Other |
(4) |
11 |
| – Revenue return |
134 |
146 |
| – Capital return |
397 |
(1,081) |
| Total return |
531 |
(935) |
|
|
 |
|
 |
|
|
|
| |
| Table 2: Total return by business and geography (£m) |
| year to 31 March 2004 |
| |
UK |
Continental
Europe |
US |
Asia Pacific |
Total |
| Buy-outs |
123 |
185 |
(4) |
31 |
335 |
| Growth capital |
238 |
(16) |
1 |
8 |
231 |
| Venture capital |
25 |
(28) |
(24) |
(8) |
(35) |
| Total |
386 |
141 |
(27) |
31 |
531 |
| |
|
|
|
|
|
| Returns are stated after currency translation losses. |
|
|
|
|
|
The main drivers of the total return were a good level of
profitable realisations and strong growth in the value of the
portfolio. The latter was due to two main factors: the use of
higher earnings multiples, as a result of rising stock markets; and
a good level of “first-time uplifts” on a number of recent
investments in the mid-market buy-out portfolio as they moved from
being valued at cost to being valued on the earnings basis. The
total return also reflects an unrealised loss on foreign currency
translation of £64 million, arising on 3i’s euro- and US
dollar-denominated portfolios net of currency borrowings, as
sterling appreciated over the year relative to the euro (up 3%) and
the US dollar (up 16%).
Improved results in each of 3i’s business areas underpinned the
overall return. The mid-market buy-out return of 22.6% (on opening
shareholders’ funds attributed to this activity) was largely driven
by growth in the value of the portfolio, with strong first-time
uplifts on a number of recent investments and a minimal level of
provisions. Returns in the smaller buy-out and growth capital
businesses, of 22.1% and 26.8% respectively, were driven by strong
realisations, while the portfolios increased in value mainly as a
result of using higher earnings multiples. Both businesses
continued to generate a good income yield. The venture capital
business produced a total return of (6.0)%, though its return was
broadly break-even before the impact of foreign currency
translation losses. There were a small number of funding rounds at
higher company valuations, allowing us to increase the carrying
value of these investments, but we have not sought to reflect in
the valuations of unquoted venture capital investments the
significant rise in quoted technology indices over the year.
Geographically, 3i’s returns in the UK, continental Europe and
Asia Pacific were strong. The return in the UK of 22.2% was driven
mainly by a high level of profitable realisations and healthy value
growth in the portfolio. Whilst the buy-out and growth capital
businesses were the main contributors to the UK’s return, the
venture capital business also achieved a positive return.
In continental Europe, 3i’s return of 14.5% (17.5% before the
impact of unrealised foreign currency translation losses of £29
million) was largely due to the high level of first-time
uplifts.
In Asia Pacific, the sale of our investment in Vantec
Corporation, the logistics business acquired from Nissan in 2001,
was the main contributor to our 34.3% return.
The US business made a loss of (7.4)% before taking account of
the £17 million translation difference arising on the
dollar-denominated portfolio (net of dollar borrowings).
Investment
3i invested a total of £784 million (£979 million including
investment on behalf of co-investment funds), which is a 9.5%
increase over the prior year.
During the first half of the year, 3i invested £211 million,
with the balance of £573 million being invested in the second half.
The substantial increase in the second half was largely due to 3i’s
ability to complete new investment opportunities that had built up
in the new investment pipeline up to 30 September – in contrast to
the low pipeline coming in to the financial year, reflecting the
deferral of many strategic decisions by businesses and investors in
an environment of business uncertainty during the extended build-up
to the hostilities in Iraq.
An analysis of the amount invested by business and geography is
given in table 5. Buy-out transactions represented 42% of total
investment, growth capital 37% and venture capital 21%. Of the
amount invested in venture capital, 55% was further investment into
existing portfolio companies.
Continental European investment represented 51% of investment,
up from 42% in the prior year, and is a reflection of our ability,
through the network, to source and complete larger deals across
Europe. The UK represented 39% (down from 44%), with the US and
Asia Pacific investing 8% and 2% respectively.
|
|
|
| |
| Table 3: Summary of changes to investment portfolio |
| |
2004 |
2003 |
| |
£m |
£m |
| Opening portfolio |
3,939 |
5,109 |
| Investment |
784 |
716 |
| Realisation proceeds |
(923) |
(976) |
| Realised profits on disposal of investments |
228 |
190 |
| Unrealised profits/(losses) on revaluation of investments |
336 |
(1,159) |
| Other |
(38) |
59 |
| Closing portfolio |
4,326 |
3,939 |
| |
|
|
|
|
|
|
|
|
| |
| Table 4: First and subsequent investment |
|
|
| |
2004 |
2003 |
| |
£m |
£m |
| New first investments |
535 |
432 |
| Further funding or drawdown on existing arrangements |
249 |
284 |
| Total |
784 |
716 |
|
|
|
|
|
|
|
|
| |
| Table 5: Investment by business and geography (£m) |
| |
| |
UK |
Continental
Europe |
US |
Asia Pacific |
Total |
| |
2004 |
2003 |
2004 |
2003 |
2004 |
2003 |
2004 |
2003 |
2004 |
2003 |
| Buy-outs |
86 |
163 |
240 |
149 |
– |
– |
– |
– |
326 |
312 |
| Growth capital |
166 |
112 |
111 |
75 |
3 |
32 |
9 |
15 |
289 |
234 |
| Venture capital |
57 |
43 |
50 |
80 |
58 |
42 |
4 |
5 |
169 |
170 |
| Total |
309 |
318 |
401 |
304 |
61 |
74 |
13 |
20 |
784 |
716 |
|
|
|
|
|
Realisations
Despite a relatively poor environment for realisations, 3i
generated good realisation proceeds of £923 million (2003: £976
million) and strong realised profits of £228 million (2003: £190
million). Realised profits are stated net of write-offs, which
amounted to £50 million (2003: £79 million).
The aggregate uplift over 31 March 2003 valuations on equity
realisations was 58% and, including sales and redemptions of loans
and fixed income shares, 18% of the opening portfolio was
realised.
Table 6 shows an analysis of realisation proceeds by business
and geography. The growth capital and smaller buy-out businesses
were particularly active in generating realisations, mainly through
a focus on selling investments that have been in the portfolio for
several years.
|
|
|
| |
| Table 6: Realisation proceeds by business and geography (£m) |
| |
UK |
Continental
Europe |
US |
Asia Pacific |
Total |
| |
2004 |
2003 |
2004 |
2003 |
2004 |
2003 |
2004 |
2003 |
2004 |
2003 |
| Buy-outs |
229 |
467 |
178 |
142 |
– |
– |
57 |
4 |
464 |
613 |
| Growth capital |
303 |
199 |
34 |
66 |
– |
– |
2 |
5 |
339 |
270 |
| Venture capital |
76 |
61 |
33 |
30 |
10 |
2 |
1 |
– |
120 |
93 |
| Total |
608 |
727 |
245 |
238 |
10 |
2 |
60 |
9 |
923 |
976 |
|
|
|
|
|
Sales of quoted equity benefited from the general rise in equity
markets, with £40 million of profits generated over 31 March 2003
valuations (an uplift of 51%). Four investee companies achieved
IPOs during the year, with the most high profile probably being
that achieved by Cambridge Silicon Radio (“CSR”) in February (see
case study). The
successful IPO of CSR, a leading manufacturer of single-chip
Bluetooth wireless devices, at a market capitalisation of £240
million was seen as a key test of the stock market’s appetite in
Europe.
Unrealised value movement
The unrealised value movement on the revaluation of investments was
a positive £336 million, representing a significant improvement on
the £1,159 million value reduction in the prior year. An analysis
of the different components of the value movement is given in table
7.
|
|
|
| |
| Table 7: Unrealised profits/(losses) on revaluation of investments |
| |
|
|
| |
2004 |
2003 |
| |
£m |
£m |
| Earnings multiples |
287 |
(244) |
| Earnings |
(37) |
48 |
| First-time valuation uplift from cost |
238 |
31 |
| Provisions |
(143) |
(379) |
| Down rounds and restructuring |
(70) |
(361) |
| Other movements on unquoted investments |
1 |
(45) |
| Quoted portfolio |
60 |
(209) |
| Total |
336 |
(1,159) |
|
|
|
|
|
The weighted average earnings multiple applied to investments
valued on an earnings basis rose from 8.1 to 12.0 over the period.
The impact of increased earnings multiples on investments valued on
an earnings basis at the start and end of the year generated value
growth of £287 million (2003: £244 million value reduction).
There was a fall of 4% over the year in the aggregate
attributable earnings of investments valued on an earnings basis at
the start and end of the year, giving rise to a value reduction of
£37 million (2003: £48 million value increase). Two larger
investments whose profits fell significantly during 2003 were the
main components of this value reduction, but the fall in earnings
is also due to the use of historical audited accounts (therefore
not reflecting the more recent upturn in the economic environment)
in valuing most of this component of the portfolio.
It should be noted (by reference to table 7) that the value
movement relating to first-time uplifts includes £71 million which
is due to earnings growth and that the “other movements on unquoted
investments” item includes £7 million in respect of companies that
recovered from making losses to being profitable. The net value
movement due to earnings growth is therefore a £41 million
increase.
First-time uplifts totalled £238 million (2003: £31 million).
This is a reflection of the quality of investments made in recent
years and the results beginning to come through as value growth
strategies in investee businesses are implemented.
Provisions for investments in businesses which may fail totalled
£143 million (2003: £379 million) and valuation reductions relating
to the application of our downround methodology and restructuring
provisions fell significantly to £70 million (2003: £361 million).
The latter figure is stated net of valuation increases of £65
million, arising as a result of investee companies raising funds
from new investors at increased values.
The quoted investments held at the end of the year increased in
value by an aggregate £60 million over the year.
Carried interest and investment performance plans
Market practice in the private equity and venture capital industry
is to offer investment staff the opportunity to participate in
returns from successful investments. Amounts payable on the
successful realisation of investments in the year to 31 March 2004
totalled £8 million. A further £32 million has been accrued in
respect of amounts potentially payable if assets are ultimately
realised at the values they were held at in the accounts at 31
March 2004.
Income and costs
The main elements of income and costs are shown in table 1.
Total operating income before interest payable was £267 million
(2003: £308 million). The decrease when compared with the prior
year reflects a lower level of special interest and dividend
receipts during the year and the realisation of a small number of
higher yielding investments. Fee income is marginally lower than in
the prior year, although there was a substantial increase in the
second half of the year, with arrangement and negotiation fees
contributing strongly.
Net interest payable decreased, reflecting the reduction in net
borrowings and also the lower average rate of interest on long-term
borrowings following the €550 million convertible bond issue in
August 2003.
Management expenses of £163 million (2003: £163 million) include
fundraising costs of £6 million incurred in connection with the
Eurofund IV fundraising and a higher level of staff bonuses than in
the prior year.
The portfolio
At 31 March 2004, the portfolio comprised 1,878 investments, a
reduction from 2,162 a year earlier and a reflection of the
strategy of seeking exits from investments where we believe the
value growth potential is not sufficiently attractive. We would
expect this number to continue to decrease over the medium
term.
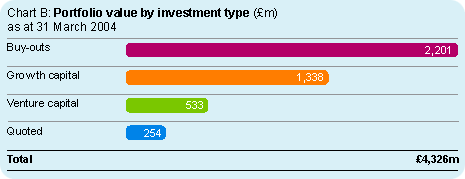
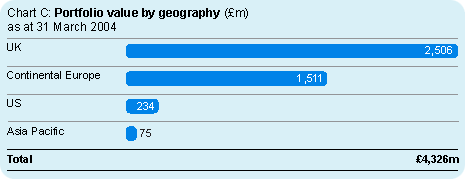
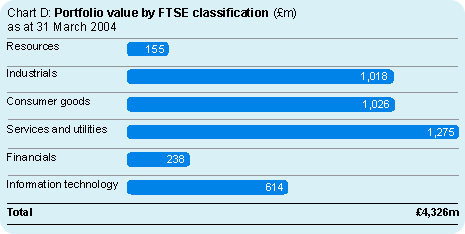
Charts B, C and D show the portfolio analysed by investment
type, geography and sector respectively and demonstrate the balance
we seek in the business. At the year end, 53% of the portfolio is
represented by buy-outs, 35% by growth capital investments and 12%
by venture capital investments. Geographically, 58% is in the UK,
35% in continental Europe, 5% in the US and 2% in Asia Pacific.
3i’s portfolio, in contrast to many others in the private equity
and venture capital industry, has relatively low exposure to
individual company risk, with the top 10 investments representing
13% by value at the year end and the top 50 investments 35%.
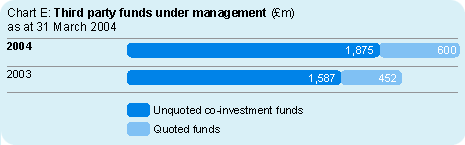
Fund management activities
Fund management activities comprise the management of both private
equity funds and quoted funds.
The private equity funds are primarily co-invested alongside
3i’s own capital when financing buy-outs, enabling an investment to
be made without 3i holding a majority interest. During the year, 3i
earned fee income of £31 million (2003: £34 million) from the
management of private equity funds. In addition, 3i receives
carried interest in respect of third-party funds under management.
During the year, 3i received
£1.7 million in respect of realised investments and accrued an
additional £1.7 million in respect of unrealised investments. At 31
March 2004, the invested portfolio managed on behalf of private
equity fund investors was valued at £1,324 million (2003: £1,158
million), excluding undrawn commitments.
During the year, we announced that the final closing of Eurofund
IV, the latest fund targeted at pan European mid-market buy-outs,
would take place by 30 June 2004. It is expected that third party
commitments will amount to at least €800 million over the life of
the fund, enabling 3i (together with the fund) to invest up to €3
billion in buy-outs over the next three years.
3i Asset Management manages 3i’s portfolio of quoted investments
(comprising principally our holdings in investments that have
achieved an IPO) as well as the portfolios of the 3i Group Pension
Plan and of three quoted specialist investment companies (3i
Smaller Quoted Companies Trust plc, 3i Bioscience Investment Trust
plc and 3i European Technology Trust plc). At 31 March 2004, total
third party quoted funds under management were £600 million. Fees
earned from quoted fund management amounted to £4 million (2003: £4
million).
Accounting policies and valuation
New valuation methodology
In August 2003, the British Venture Capital Association (“BVCA”)
issued new valuation guidelines for private equity and venture
capital investments, which resulted in changes being made to 3i’s
portfolio
valuation methodology. The new methodology has been approved by
the Board and was applied in carrying out the 31 March 2004
portfolio valuation. The net impact of these changes on the overall
valuation of the portfolio was immaterial.
Changes to accounting policies
There have been no changes to accounting policies during the
year.
Introduction of international financial reporting
standards
In June 2002, the European Union adopted a regulation that
requires, from 1 January 2005, European listed companies to prepare
their consolidated financial statements in accordance with
international accounting standards. 3i’s 31 March 2006 financial
statements will therefore be prepared in accordance with
International Financial Reporting Standards (“IFRS”). These
comprise not only IFRS but also International Accounting Standards
(“IAS”). Details of 3i’s implementation programme are discussed
within Accounting
policies.
Financial review
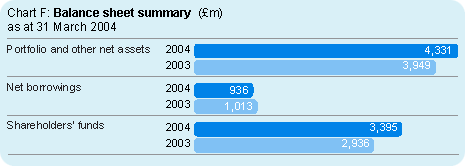
Cash flows
The key cash flows during the year were the aggregate cash outflow
of £756 million in respect of investment and cash inflows totalling
£913 million in respect of proceeds received on realising
investments. Net cash inflow for the year was
£45 million (2003: £170 million), reducing net borrowings at the
year end to
£936 million (2003: £1,013 million). With the significant growth in
the value of the portfolio during the year, gearing fell to 28% at
31 March 2004 compared with 35% a year earlier.
Capital structure
3i’s capital structure comprises a combination of shareholders’
funds, long-term borrowing, short-term borrowing and liquid
treasury assets and cash.
The major changes in capital structure during the year, other
than the growth in shareholders’ funds, were the €550 million
convertible bond issue completed in August 2003 and the replacement
of the £625 million multi-currency facility in January with a new
€595 million revolving credit facility. The convertible bonds are
due in 2008 and have a conversion price of 842p (a 45% premium to
the “reference price” of 580p) and an annual coupon of 1.375%.
Long-term borrowing at 31 March 2004 is £1,595 million and is
repayable as follows: £5 million between one and two years, £944
million between two and five years and £646 million after five
years. In addition, at the year end, 3i had committed and undrawn
borrowing facilities amounting to £583 million and cash and other
liquid assets totalling £819 million. We are confident we have in
place adequate funding for foreseeable investment needs.
3i Group plc has credit ratings with Moodys and Standard &
Poor's of Aa3/stable and A+/stable respectively.
Regulation and risk management
Introduction
3i Group plc and relevant subsidiaries continue to be authorised
and regulated by the Financial Services Authority.
3i has a comprehensive framework to manage the risks that are
inherent in its business. This framework includes a risk committee
whose purpose is to monitor the identification, assessment and
management of key risks across the business. The main risks
comprise economic risk, treasury and funding risk, investment risk
and operational risk.
Economic risk
3i invests mainly in European companies and continues to develop
its operations in the US and Asia Pacific. However, the majority of
the portfolio (58%) is still in UK companies and there is an
element of exposure to the UK economic cycle. To mitigate this, 3i
has invested in different sectors of the UK economy with different
economic cycles. In addition, an increasing proportion of assets is
invested in continental Europe, in the US and in Asia Pacific,
which may have different economic cycles.
Treasury and funding risk
The overall funding objective continues to be that each category of
investment asset is broadly matched with liabilities and
shareholders’ funds, with corresponding characteristics in terms of
risk and maturity, and that funding needs are met ahead of planned
investment. This objective continued to be met during the year
ended 31 March 2004.
All assets and liabilities are held for non-trading purposes
and, as a result, 3i does not have a trading book. 3i does not
trade in derivatives and does not enter into transactions of either
a speculative nature or unrelated to 3i’s investment activities.
Derivatives are used to manage the risks arising from 3i’s
investment activities.
The main funding risks faced by 3i are interest rate risk and
exchange rate risk. The level of these risks is mitigated by the
overall funding objective and the Board regularly reviews and
approves policies on the approach to each of these risks.
3i’s policy for exchange rate risk management is not generally
to hedge its overall portfolio in continental Europe or the US. In
line with its funding policy, part of those assets are funded by
borrowings in local currency and, as a result, a partial hedge
exists. 3i’s largest exposure is £0.8 billion in respect of net
assets denominated in euros in continental Europe. The level of
exposure to exchange rate risk is reviewed on a periodic basis.
Day to day management of treasury activities is delegated to
executive Directors and the Group Treasurer. Regular reports on
3i’s funding position have been considered during the year by the
Board. There has been no change during the year or since the year
end to the major funding risks faced by 3i, or to 3i’s approach to
such risks.
Investment risk
This includes investing in companies that may not perform as
expected, being over exposed to one sector of the economy and the
portfolio valuation being partly based on stock market
valuations.
Investment levels are set, allocated and monitored by product
area and geography. Within this framework, 3i invests in all
sectors of the economy, except those, such as property, where the
opportunity to invest in private equity and venture capital backed
businesses meeting 3i’s investment criteria is limited. Management
periodically reviews the portfolio, which is well diversified by
industry sector, to ensure that there is no undue exposure to any
one sector.
3i’s investment criteria focus on management ability and market
potential. Investment appraisal and due diligence are undertaken in
a rigorous manner by drawing on our international network and
experts in individual industry sectors. In general, proposed
investments over £5 million are presented to 3i’s Investment
Committee or Technology Investment Committee, which are committees
of senior management including executive Directors.
The valuation of a large proportion of 3i’s equity portfolio is
based on stock market valuations for the relevant industry sector.
Quoted investments are valued using the closing mid-market price at
the balance sheet date. 48% of the unquoted portfolio is valued
using stock market earnings multiples for the relevant industry
sector discounted for non-marketability. Accordingly, stock market
valuations for individual sectors are an important factor in
determining the valuation of 3i’s portfolio and the total
return.
There are regular reviews of holdings in quoted companies and
exposure to individual sectors in order to monitor the level of
risk and mitigate exposure where appropriate. In particular, the
level of future funding of technology companies is kept under
review. However, it is not possible to protect against the risks of
a downturn in stock markets generally or in any specific
sector.
Accordingly, the valuation of 3i’s portfolio and opportunities
for realisation depend on stock market conditions and the buoyancy
of the wider mergers and acquisitions market.
Operational risk
This includes operational events such as human resources risks,
legal and regulatory risks, IT systems problems, business
disruption and shortcomings in internal controls.
Line management at all levels is responsible for identifying,
assessing, controlling and reporting operational risks. This is
supported by a framework of core values, standards and controls, a
code of business conduct and delegated authorities.
The ability to recruit, develop and retain capable people is of
fundamental importance to achieving 3i’s strategic objectives. We
operate in a competitive industry and aim to remunerate our staff
in line with market practice and to provide superior development
opportunities.
A group-wide business continuity strategy is in place. This
strategy has been assessed against a detailed business impact
analysis and independently benchmarked against best practice.
Conclusion
The year under review saw a strong return on opening shareholders’
funds, driven mainly by healthy realisation profits and good value
growth from the portfolio. In addition, 3i took advantage of
improving conditions to invest just under £1 billion (including
co-investment funds) in good businesses with attractive growth
prospects.
3i’s balance sheet at the year end is strong, with gearing at a
relatively low 28%, providing the financial capacity and
flexibility to vary investment and realisation activity in line
with market conditions.
|