Directors’ Reports
Directors’ Remuneration Report
Performance graph
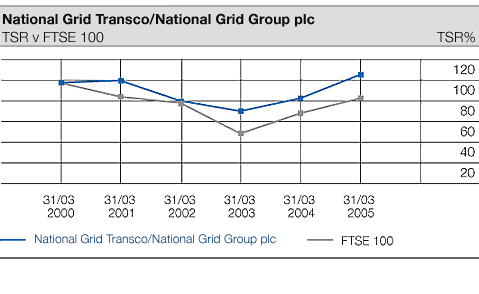
The graph below represents the comparative TSR performance of the Group from 31 March 2000 to 31 March 2005. For the period before the merger of National Grid Group plc and Lattice Group plc the TSR shown is that of National Grid Group plc.
This graph represents the Group's performance against the performance of the FTSE 100 index, which is considered suitable for this purpose as it is a broad equity market index of which National Grid Transco is a constituent. This graph has been produced in accordance with the requirements of Schedule 7A to the Companies Act 1985.
In drawing this graph it has been assumed that all dividends have been reinvested. The TSR level shown at 31 March each year is the average of the closing daily TSR levels for the 30-day period up to and including that date.


