 |
||||||||
| Our market potential | ||||||||
|
We believe that there is significant opportunity to grow our businesses profitably worldwide. We will do this by realising the potential for sales growth in all of our markets and by managing economies of scale to reduce costs.
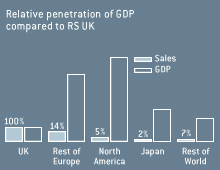
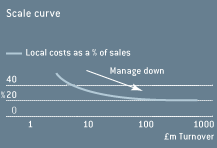
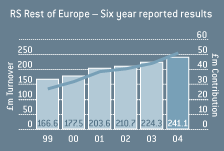
Our goal outside the UK remains to grow each of our operating companies to the same relative size and profitability as our UK business. Expanding within our markets The ‘Market penetration’ chart illustrates the scale of the opportunity in each of our geographic regions. We take RS UK’s current sales compared to UK Gross Domestic Product (GDP) as our benchmark. Our potential market is proportionate to the GDP in the countries in which we operate: we use GDP because our offer is taken up and valued, not just by the manufacturing sector, but by all sectors of an economy. This has been demonstrated in the UK, where about 50% of our customers are not in the manufacturing sector. The UK market continues to grow and our potential for growth in the UK is still significant. Scale benefits As our businesses grow in their markets over time, economies of scale are realised and local costs reduce relative to sales. Marketing costs per customer, such as catalogue costs, decrease as the number of customers and their purchasing frequency grows. The ‘Scale curve’ chart shows how local business costs as a percentage of sales fall as sales increase. With consistent gross margins across the business, this trend translates into higher contribution margins and hence profit growth ahead of sales over time. The local costs of RS UK are about 20% of sales at the current sales level. All our other businesses have lower sales and so are higher on the curve. They are all managed down the scale curve. Products and services growth When we enter a new market, our offer is initially based on electronic and electrical products. When we have a deeper understanding of our customers’ requirements we extend this range. In the UK for instance, we offer product areas ranging from health and safety to information technology, hydraulics, tools and technical books, all in response to customer demand. The loyalty of our customers is built on the quality,breadth and reliability of our services. Loyalty is measured by the frequency with which customers buy from us, and it increases as the business grows and we are able to offer new services. Breadth of purchase is another important indicator of our success, as we encourage our customers to increase the range of products that they buy from us. Strategy in action Profits continue to grow ahead of sales in Europe, as illustrated by the chart below. In addition, Japan has continued to show high growth relative to the economy and this has led to it achieving break even during the year. |
|
|||||||

We have tested a same day despatch service in the Shanghai area and customers have received this well. A full launch in Shanghai took place in April 2004. |
||||||||

|

|

|