Financial highlights
2006 £m |
*2005 £m |
*2004 £m |
2003 £m |
2002 £m |
|
1,113.8 |
993.5 |
945.6 |
937.4 |
717.1 |
|
Net premium written (1) |
1,013.5 |
829.3 |
790.2 |
787.6 |
573.0 |
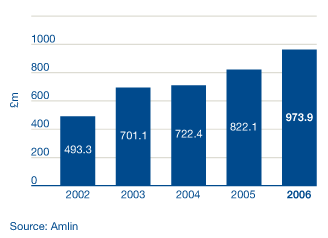
973.9 |
822.1 |
722.4 |
701.1 |
493.3 |
|
Profit before tax |
342.7 |
186.7 |
119.7 |
117.8 |
44.8 |
34.0% |
29.6% |
21.0% |
26.6% |
16.7% |
|
Per share amounts (in pence) |
|||||
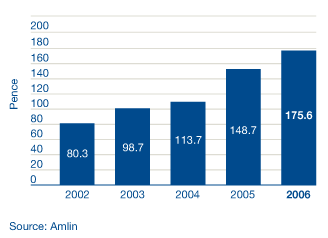
Earnings |
50.4 |
34.3 |
20.7 |
21.0 |
11.8 |
175.6 |
148.7 |
113.7 |
98.7 |
80.3 |
|
Net tangible assets |
163.2 |
136.2 |
97.0 |
82.3 |
63.7 |
10.4 |
9.0 |
4.7 |
2.1 |
0.8 |
|
Dividends (paid and proposed final) |
20.0 |
10.2 |
8.0 |
2.5 |
2.0 |
in respect of the calendar year |
|||||
Syndicate 2001 operating ratios |
|||||
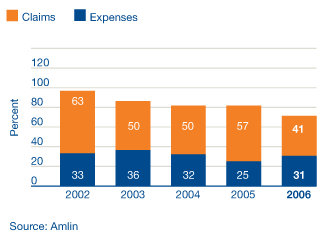
Claims ratio |
42% |
57% |
50% |
50% |
63% |
Expense ratio |
34% |
25% |
32% |
36% |
33% |
76% |
82% |
82% |
86% |
96% |
|
Amlin Bermuda Ltd operating ratios Claims ratio |
|||||
Claims ratio |
36% |
- |
- |
- |
- |
Expense ratio |
12% |
- |
- |
- |
- |
48% |
- |
- |
- |
- |
|
Basis of preparation
* The indicated columns above are restated for prior period adjustment as detailed
in the accounting policies of the statutory report and accounts
(1) Excluding premiums associated with the reinsurance to close of our increased share of capacity.
Claims ratio is net claims incurred divided by net earned premium for the year.
Expense ratio is underwriting expense incurred divided by net earned premium.
The expense ratio does not include expenses that have not been attributed to
underwriting or finance costs. Combined ratio is the total of the claims and
expense ratio.
Net earned premium
 |
Net earned premium up 18.5% |
Group combined ratio
 |
Record combined ratio of 72% |
Net assets per share
 |
Average compound annual growth in net assets per share 30% since 2002. |
