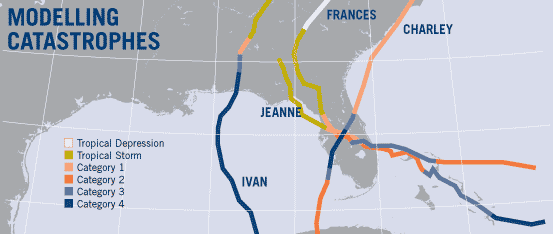
2004 will be remembered for an almost
unprecedented Atlantic hurricane season
with four major storms making landfall in
the United States and affecting Florida. The
total insured mainland US property damage
is estimated at US$22.5 billion. Risk
modelling agencies variously calculate the
likelihood of four hurricanes making landfall
in Florida as once in every 204 to 325 years.
In the immediate aftermath of each hurricane
Amlin�s risk modelling team was rapidly able
to estimate the possible loss cost to Amlin.
Preliminary and latest estimates of Amlin�s
reinsurance losses from each of the hurricanes
are as follows:
PROPERTY INSURED LOSSES $m
|
|
| Event |
Prelim. gross
loss (8.10.04) |
Latest
gross loss |
Prelim. net
loss (8.10.04) |
Latest
net loss |
|
| Charley |
61.2 |
65.7 |
22.3 |
27.4 |
|
| Frances |
63.0 |
90.4 |
34.0 |
34.7 |
|
| Ivan |
70.1 |
79.2 |
31.9 |
34.9 |
|
| Jeanne |
51.4 |
29.7 |
26.8 |
21.6 |
|
With Hurricane Jeanne taking a similar path to
Hurricane Frances there has been difficulty in
assessing which of the two caused some of the
damage and generally, where there has been
doubt, policy holders have attributed their
losses to Hurricane Frances. Also, loss costs
have generally been higher than originally
predicted because, with the overall quantity of
damage and resultant shortage of contractors
and building supplies, expected rebuilding
costs have risen.
Amlin has a dedicated catastrophe modelling
team. The group was expanded during 2004
and acts as a key link with both the
underwriting and claims teams.
We use a number of proprietary models
including AIR CATRADER� and RMS RiskLink�.
The systems combine the capture of exposed
aggregates with catalogues of thousands of
scenarios built from both historic and simulated
events. These �catalogues� contain not only
hurricane events, but also earthquakes, severe
winter storms, tornados and floods.
We continually model a range of major
exposures, by cause, location and size or
probability. Some examples, with changes in
possible loss impact over the last three years,
are shown below:
| Events |
|
Current
modelled
probability |
|
Net loss to Amlin as a
% of net tangible assets
(at 31 Dec) |
|
|
|
(years) |
|
2002 |
|
2003 |
|
2004 |
|
| Major Los Angeles earthquake |
|
1 in 250 |
|
23.7% |
|
23.8% |
|
18.6% |
|
| Major US windstorm |
|
1 in 250 |
|
30.5% |
|
21.3% |
|
15.3% |
|
| New Madrid earthquake |
|
1 in 500 |
|
30.5% |
|
21.3% |
|
15.3% |
|
| European storm |
|
1 in 100 |
|
33.9% |
|
38.3% |
|
27.3% |
|
| Japan earthquake |
|
1 in 250 |
|
29.9% |
|
23.0% |
|
23.1% |
|
| Major aviation collision |
|
n/a |
|
22.1% |
|
17.3% |
|
15.0% |
|
| Major marine collision |
|
n/a |
|
16.0% |
|
18.5% |
|
12.8% |
|
| Major UK terrorist event |
|
n/a |
|
26.3% |
|
15.3% |
|
11.7% |
|
Catastrophe modelling is not an exact science
and the agencies are constantly looking at new
data to improve modelling accuracy. The above
therefore can only be used as a guide.
Back to previous page
|