|
| THE DFA MODEL |
|
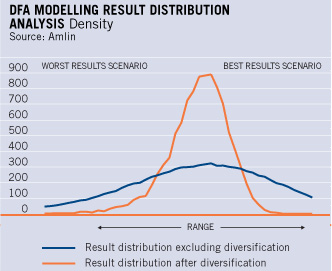
The DFA model predicts a range of possible
outcomes for each class of business based upon
historic and potential variability in claims. By
running thousands of simulated results we can
ascertain the likelihood of possible outcomes.
This can be shown by the curve below, with the
vertical axis showing the density of occurrences
(therefore likelihood) and the horizontal axis
showing the range of result.
|
The top of each curve represents the most
likely range of result, the left hand side shows
the worst result and the right hand side the
best result.
|
The blue line illustrates the overall result
without the benefit of diversification.
|
However, the DFA model takes account of
interdependence between different classes.
Some classes have a tendency to have good
or poor results at the same time, whilst
others are less correlated.
|
The orange line shows the profit distribution for
all classes combined, after taking account of
this interdependency. This illustrates that
variability of result is reduced with diversity.
Back to previous page
|