| Introduction | |
| Financial highlights | |
| Routes to market | |
| Chairman’s statement | |
| Chief executive’s review | |
| Operating review | |
| Finance director’s review | |
| Directors | |
For a printer friendly version of this Annual Report website plus PDFs of the rest of the document please visit the PDF download section . |
|
| Year to 31 March | 2000 | 1999 | % INCREASE |
|
| Turnover | £m | 1,426.8 | 1,315.3 | 8.5 |
| Operating profit | £m | 230.4 | 173.9 | 32.5 |
| Profit before tax and exceptional items | £m | 224.1 | 182.2 | 23.0 |
| Earnings before interest, tax, depreciation and amortisation | £m | 313.5 | 244.9 | 28.0 |
| Earnings per share before exceptional items | p | 31.5 | 23.9 | 31.8 |
| Dividends per share | p | 12.5 | 11.55 | 8.2 |
- Plasterboard sales volumes worldwide, on a like-for-like basis, grew 10%;
up 19% including the acquired Scandinavian and Asian businesses. Plaster volumes
grew nearly 8%
- Turnover grew 8.5% to £1.43 billion, up 13% in local currencies
- Operating profit advanced 32.5% to £230.4 million, with the group sales
margin rising almost 3 percentage points to 16.1%
- Building materials turnover and operating profit rose by 11% and 28% to £1.32
billion and £210 million respectively, and Paperboard sales margin doubled
to almost 11%
- Underlying pre-tax profit advanced 23% to £224.1 million and underlying
earnings per share rose 32% to 31.5p
- Reported profit before tax was 39% higher at £225.6 million (1999 £162.3
million after a net exceptional charge of £19.9 million)
- Cash generation from operations continued to grow rapidly, with EBITDA increasing
28% to £313.5 million and EBITDA margin rising 3.4 percentage points to
22%
- A final dividend of 8.25p per share, generating an 8.2% increase in the full year dividend to 12.5p, 2.5 times covered by underlying earnings
TURNOVER UP 8.5%
OPERATING PROFIT UP 32%
UNDERLYING PBT UP 23%
REPORTED PBT UP 39%
EBITDA UP 28%
UNDERLYING EPS UP 32%
FULL YEAR DIVIDEND UP 8.2%
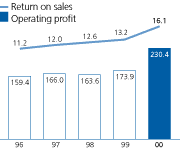
Operating profit £ million and return on sales %
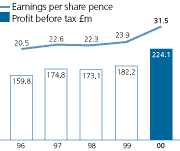
Underlying results before exceptional items
[ back to top ]