| Introduction | |
| Financial highlights | |
| Routes to market | |
| Chairman’s statement | |
| Chief executive’s review | |
| Operating review | |
| Finance director’s review | |
| Directors | |
For a printer friendly version of this Annual Report website plus PDFs of the rest of the document please visit the PDF download section . |
|
This was a year of strong financial performance for BPB, with:
- Underlying profit before tax up 23% to £224.1 million.
- Reported pre-tax profit 39% ahead at £225.6 million in the absence of
any exceptional charges this year.
- Underlying earnings per share better by 31.8% at 31.5p.
- Free cash flow almost five times higher at £111.5 million before, and
almost four times higher at £88.1 million after, excluding cash flows of
a one-off nature this year.
- Post-tax return on average capital invested up 1.9 percentage points to 12.1%,
comfortably ahead of our weighted average cost of capital, which is estimated
to have been in the range 8.5% to 9.5% during the year.
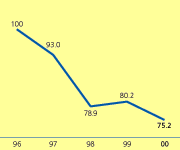
The strength of sterling referred to above has been a significant feature of the last few years. Some 50% of group turnover and operating profit is generated in the euro zone. The fall in the French franc/sterling exchange rate is representative of the continuing decline in value of key European currencies against sterling in the period since 1995/96. Had exchange rates remained at 1995/96 average levels, our turnover this year would have been almost £282 million (20%) higher, and our operating profit £43 million (19%) higher.
In 1999/00 exchange losses on the translation of overseas profits cost us £6.4 million, of which £5.8 million was in the second half.
Drivers of shareholder value
The growth in our earnings per share is explained by progress we have made against each of the drivers of shareholder value set out in my report last year. These drivers reflect the attention management gives to:
- Improved and sustainable operating margins.
- Return on investment at above the weighted average cost of capital.
- An efficient capital structure.
Turnover increased by 8.5% to almost £1.43 billion. Excluding the impact of foreign exchange, underlying turnover growth was 13% with building materials up 16%.
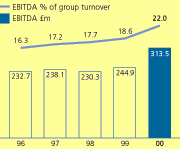
Operating margin improved by 2.9 percentage points to 16.1% and EBITDA margin (earnings before interest, tax, depreciation less deferred credits, and amortisation as a percentage of group sales) was up by 3.4 percentage points to 22.0%. EBITDA is a simple measure of cash flow that is used extensively in business valuation models. Operating profit increased by 32.5% to £230.4 million net of redundancy costs of £8.8 million (1999 £6.8 million) associated with cost saving initiatives.
The performance of our major acquisition last year, BPB Gyproc in Scandinavia, was earnings enhancing. It generated operating profit of £14.3 million, prior to charging redundancy costs of £3.5 million and amortisation of goodwill of £3.2 million.
The group spent in total £52.4 million on acquisitions during the year, including:
- £23.8 million for a 70.75% share in Thai Gypsum Products (‘TGP’).
Early trading indications are encouraging in the three months since acquisition.
TGP’s turnover in the year prior to acquisition was £25 million.
- £14.6 million in purchasing TGP’s 23% minority shareholding in
Gypco Shanghai and making payments we had already committed under the subscription
agreement entered into last year. By 31 March 2000, we had invested a total of
£20.7 million to acquire an 83.1% equity interest in Gypco, with a remaining
commitment to invest £2.3 million. Gypco’s 20 million square metre
capacity plasterboard plant was successfully commissioned in December.
- £14.0 million on other acquisitions, including Gypsum Turda in Romania
and the purchase of minority interests in group companies in Spain and France.
In April, we completed the purchase of Heidelberger Dammsysteme, one of the largest European manufacturers of expanded polystyrene insulation products, for £22 million on a debt free basis. The company’s pro forma 1999 turnover and operating profit was £47 million and £2 million respectively.
The planned Celotex Corporation acquisition for US$345 million, referred to on pages 5 and 7, will be financed using existing committed debt facilities.


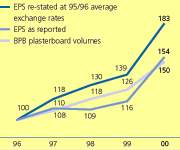
Earnings per share before exceptional items, and worldwide plasterboard volume growth indexed

French franc v sterling exchange rate indexed
the translation of profitable growth into cash flow through careful control of capital expenditure and working capital
EBITDA was up 28% at £313.5 million this year, in line with the growth in operating results. This demonstrates that our profits are high quality and are backed by strong cash generation.
Capital spend fell to £83.4 million (just over one times depreciation) from £124.5 million, following the commissioning of four major new plants at the beginning of the year. We expect to maintain capital spend in the ratio of 1 to 1.25 times annual depreciation, with over half devoted to growth and cost reduction projects and the balance being available for essential replacement, health, safety and environmental schemes. At the year end, the amount of investment authorised but not spent was £86 million, including £36 million for the new combined plasterboard and plaster plant at Termoli, Italy, announced in April.
Working capital increased by £23.0 million (1999 £0.3 million). Most of this is attributable to the general increase in trading activity this year, and high plasterboard volumes just prior to the year end. The new plants commissioned during the year also added to working capital requirements.
Free cash flow increased to £111.5 million (1999 £23.9 million) reflecting the combination of improved margins and lower capital expenditure.

EBITDA (earnings before interest, tax, depreciation and amortisation) £ million
| Group cash flow | 2000 £m |
1999 £m |
| EBITDA | 313.5 | 244.9 |
| Net movement in working capital | (23.0) | (0.3) |
| Capital expenditure | (83.4) | (124.5) |
| Taxation | (18.1) | (66.4) |
| Interest | (11.0) | (3.7) |
| Dividends | (76.1) | (37.3) |
| Other | 9.6 | 11.2 |
| Free cash flow | 111.5 | 23.9 |
| Acquisitions and disposals | (53.8) | (127.4) |
| Share buy-backs | (69.9) | (84.4) |
| Exceptional interest charge on convertible bond buy-back | – | (2.1) |
| Net cash flow | (12.2) | (190.0) |
an efficient capital structure that optimises our overall cost of capital
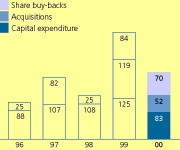
The higher level of net debt reported last year has been maintained with net debt at 31 March 2000 of £253.6 million (1999 £270.6 million) and gearing of 33.4%. The total invested in the year in acquisitions, capital expenditure and buy-backs was £205.7 million (1999 £328.3 million). In the year we bought back a further 21.6 million shares at a cost of £69.9 million bringing to £154 million the total returned to shareholders through share buy-backs over the last two years. We estimate the 1999/00 enhancement to earnings per share arising from the cumulative return of capital to be some 9%. The full annual earnings enhancement gained from the share buy-backs will be 10%.
Return on investment improved to 12.1% from 10.2%, comfortably in excess of our estimated cost of capital, reflecting the strong results and stable capital invested of £1.3 billion.
Improved results and the further retirement of equity boosted return on average shareholders’ funds to 15.4% (1999 12.2%). Shareholders’ funds of £736.5 million remained relatively stable with retained profit in the year of £91.7 million being offset by adverse exchange movements of £41.3 million on the translation of overseas net assets and funds returned to shareholders through share buy-backs of £69.9 million.

Capital expenditure, acquisitions and share buy-backs £ million cash spend
| [ 1 | 2 ] | continued >> |
[ back to top ]