Performance
Profitability and return
Investment performance
The investment environment in 2008 was marked by both extreme volatility and extreme pessimism, culminating in the panic deleveraging during the final quarter. Consequently it was a difficult year to make a positive return. Overall investments generated a profit of £18.0 million for the year (2007: £157.0 million) representing a return of 0.6% (2007: 6.6%) on average assets of £2.6 billion (2007: £2.5 billion).
| Investment mix and returns | ||||
|---|---|---|---|---|
| Average Asset Allocation £m |
Return £m |
Average Asset Allocation £m |
Return £m |
|
| Bonds | 1,539 | 87 | 1,598 | 96 |
| Other liquid investments | 818 | 31 | 542 | 27 |
| Equities | 206 | (91) | 286 | 28 |
| Property | 80 | (9) | 59 | 6 |
| Total | 2,643 | 18 | 2,485 | 157 |
| Bonds |
58% |
3.5% |
64% |
6.3% |
| Other liquid investments | 31% | 4.0% | 22% | 5.5% |
| Equities | 8% | (26.5%) | 12% | 10.2% |
| Property | 3% | (6.3%) | 2% | 9.8% |
| Total | 100% | 0.6% | 100% | 6.6% |
| Note: Investment return percentages exclude the impact of currency instruments Source: Amlin |
||||
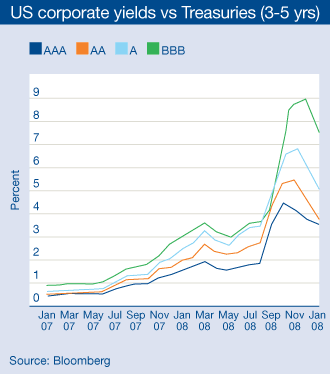
On average 58% of our portfolio was invested in bonds. All our bond portfolios were benchmarked against sovereign debt indices. The flight to quality, interest rate cuts and the fear of deflation meant that these performed well during the year. However, the spread of credit yields relative to government yields rose dramatically as a result of the economic downturn and then deleveraging. This is shown in the following chart. Although the credit quality of our bond portfolio was high, the managers’ non-benchmark credit exposure, such as corporate bonds and mortgage backed securities, dragged down returns. The combined bond return was 3.5% (2007:6.3%)
Our cautious investment stance during the year also meant that the average cash balance during the year was 31%, which returned 4% (2007: 5.5%). Equally, we were more defensive on our equity portfolio. It was cut back in 2007 and was partially protected by hedges until the end of September. However, the equity return was still a negative 26.5% (2007: gain 10.2%). Similarly the property portfolios return was a negative 6.3% (2007: gain 9.8%), again despite being defensively positioned.

